Let's go create
Got an idea and need to supercharge it to the next level?
Send us a message and get the ball rolling
Or email us [email protected]
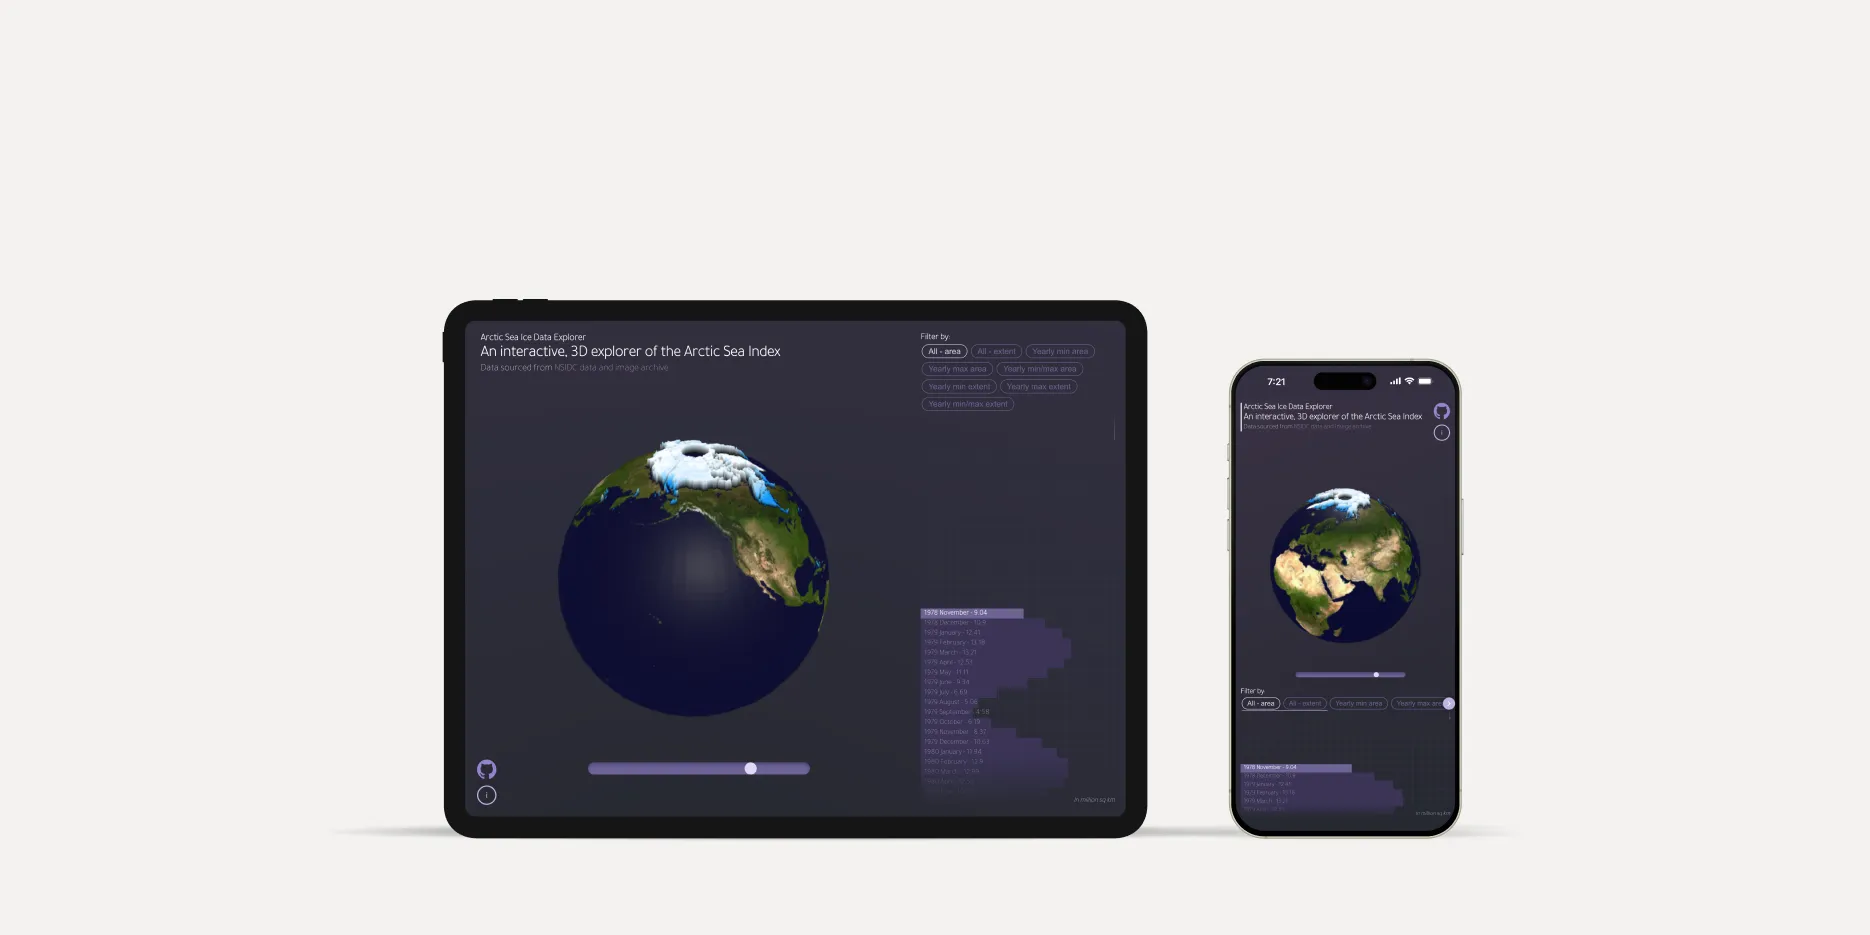
Each month, NASA satellites capture the breathtaking yet sobering story of Arctic sea ice - its extent, its volume, its gradual decline.
We designed and developed a web-based, 3D data visualiser, making insights tangible and accessible.
The datasets are large and complex. Navigating them can be challenging, especially for those without training or the special tools to interpret the data effectively.
While traditional visualisations like 2D graphs and charts are helpful, they don't fully convey the spatial nature of Arctic sea ice data.
Our goal is to make this data more accessible.
Loading sequence
Arctic sea ice datasets are massive and intricate. They live in folders filled with satellite imagery and numerical models that are difficult to compare or interpret without technical expertise.
Conventional tools - like 2D graphs and charts - capture some of the story, but miss the spatial complexity and emotional impact of witnessing Earth’s polar shifts.
We wanted to explore: What if climate data felt less like reading a spreadsheet and more like exploring a living, breathing planet?
3D to 2D transitions using custom shaders
Got an idea and need to supercharge it to the next level?
Send us a message and get the ball rolling
Or email us [email protected]